| 1 |
[](https://perfops.one/decalogDecaLog](https://perfops.one/decalog](https://perfops.one/decalog) have the ability to log WordPress traces. |
| 2 |
|
| 3 |
These __traces__ can be sent to specialized services or displayed in the WordPress admin. |
| 4 |
|
| 5 |
## Anatomy of a trace |
| 6 |
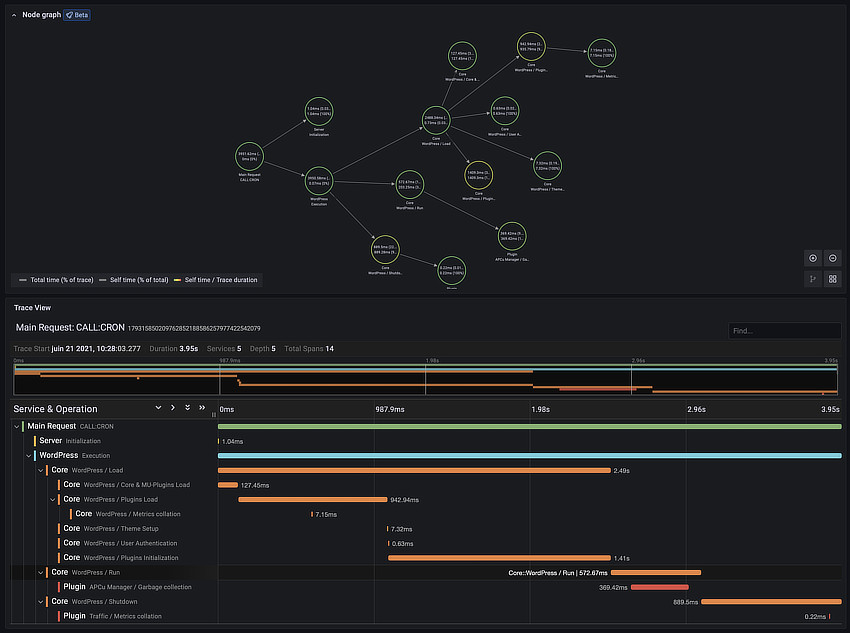
A __trace__ belongs to a __channel__, which is the type of "execution pipe" where the __trace__ was recorded. It can take the following values: `CLI` (command-line interface), `CRON` (cron job), `AJAX` (Ajax request), `XMLRPC` (XML-RPC request), `API` (Rest API request), `FEED` (Atom/RDF/RSS feed), `WBACK` (site backend), `WFRONT` (site frontend). |
| 7 |
|
| 8 |
Each __trace__ contains a list of __spans__ which are mainly composed of: |
| 9 |
- A __process__, which can be: `core`, `plugin`, `theme`, `library`, `db`, `php`. |
| 10 |
- A __name__, which is given in the form "Component / Operation". |
| 11 |
- A __start time__, which is the starting timestamp of the span. |
| 12 |
- A __duration__, which is the duration of the span. |
| 13 |
|
| 14 |
All fields, times and tags/labels are handled and automatically set by DecaLog. |
| 15 |
|
| 16 |
 |
| 17 |
|
| 18 |
_Typical trace sent by DecaLog and visualized in Grafana_ |
| 19 |
|
